Back to Research
Utilization rate forecasting for EV charging infrastructure

Abdulrahman Elbanna
AuthorDec 11, 2025
8 min read
The problem
Charging Point Operators (CPOs) face two critical questions when selecting sites for EV charging infrastructure:
- Is building here feasible? (grid capacity, land, regulations)
- How much revenue the will site generate? (utilization rates)
Predicting utilization is challenging because historical usage data is scarce, expensive, or unavailable—especially for new markets.
The Solution
We developed a a machine learning model that predicts utilization without historical usage data. The model predicts utilization rate by combining:
- Stochastic simulation with real-world location data
- Public sources: Google Maps API, OpenStreetMap, demographic data
- Machine learning to find the correlation between the charging infrastructure specifications, location context; and utilization rate

Our GridOS AI agent now uses this ML model as a tool to help CPOs find and assess sites that maximize revenue.
Why charger technical specifications is not enough?
We started by testing whether charger specifications alone could predict usage. Using five infrastructure features (charging power, number of points, fast/slow designation, total capacity, and charger type), we built an initial baseline model that achieved R² = 0.15 in cross-validation.
The limitation became clear when examining predictions: the model could rank chargers by capacity but couldn't distinguish between a high-capacity charger in a district with 10,000 EVs versus one in a district with 500 EVs. Both would receive similar predictions based on their specifications alone.
This revealed the core issue: we weren't predicting an inherent property of the charger, but rather the interaction between infrastructure and its environment. A charger's utilization depends on both what it can provide and whether local demand exists to use it.
Adding the missing context
We expanded the feature set to include location characteristics: POI density (shops, restaurants, amenities nearby), traffic volume, and popular times data. These features capture the activity level and accessibility of each location—chargers in high-traffic areas with many nearby amenities have more opportunities for usage than isolated locations.
We also added classification variables distinguishing urban/rural settings, roadside/interior positions, and highway/local roads. Performance improved to R² = 0.65, though rural areas remained problematic. The model recognized location activity without accounting for local EV fleet size.
Incorporating market data and location context
We integrated vehicle registration data at the district level: total vehicles, EV adoption rates, and vehicle density per capita. This established an upper bound, even optimal infrastructure and location can't achieve high utilization in districts with few EVs.
The key innovation was creating interaction features that encode relationships between dimensions. These features capture how capacity and market size multiply together rather than add independently. High capacity in a high-EV market amplifies potential; high capacity in a low-EV market hits a ceiling.
These interactions matter because gradient boosting models struggle to automatically discover multiplicative relationships. Without explicit interaction terms, the model treats capacity and market size as independent additive effects, missing their combined impact.
Scenario classification
We classified chargers into 10 usage scenarios based on location context: highway rest stops, gas stations, urban parking, office buildings, residential areas, park-and-ride facilities, and others. Each scenario exhibits distinct usage patterns, highway chargers serve long-distance travelers with short charging sessions, while residential chargers support overnight charging with longer dwell times.
This classification helped validate model predictions by ensuring performance remained consistent across different use cases rather than overfitting to a single scenario type.
Model selection
We evaluated six approaches using 5-fold GroupKFold cross-validation (grouped by scenario type to prevent data leakage): Random Forest, Gradient Boosting, HistGradientBoosting, XGBoost, Extra Trees and Ridge regression baseline.
HistGradientBoosting achieved the best cross-validation performance (R² = 0.8567) and was selected for three practical reasons: native missing value handling (critical given fragmented data sources), direct categorical feature support, and natural capture of non-linear interactions between features. The model revealed that market-related features, infrastructure specifications, and location context each contributed roughly equally to predictive power, confirming that all three dimensions are critical for accurate predictions.
Feature categories
Our features break down into three categories:
Infrastructure: Capacity specifications and charging speed capabilities form the baseline.
Location Context: POI density, traffic volume, and location type (highway, urban, roadside) capture the activity level and accessibility of each site.
Market Demand: EV fleet size in the district establishes the upper bound on potential utilization.
The most important features were the interaction terms combining infrastructure with market size. These dimensions must align—high capacity without sufficient local EV demand cannot achieve high utilization. High capacity in a high-EV district amplifies potential; high capacity in a low EV district hits a ceiling regardless of location quality.
Results
We evaluated six algorithms; the strongest non-neural model was HistGradientBoosting, which achieved:
- Test RMSE: 0.0397
- Test MAE: 0.0254
- Test R²: 0.857
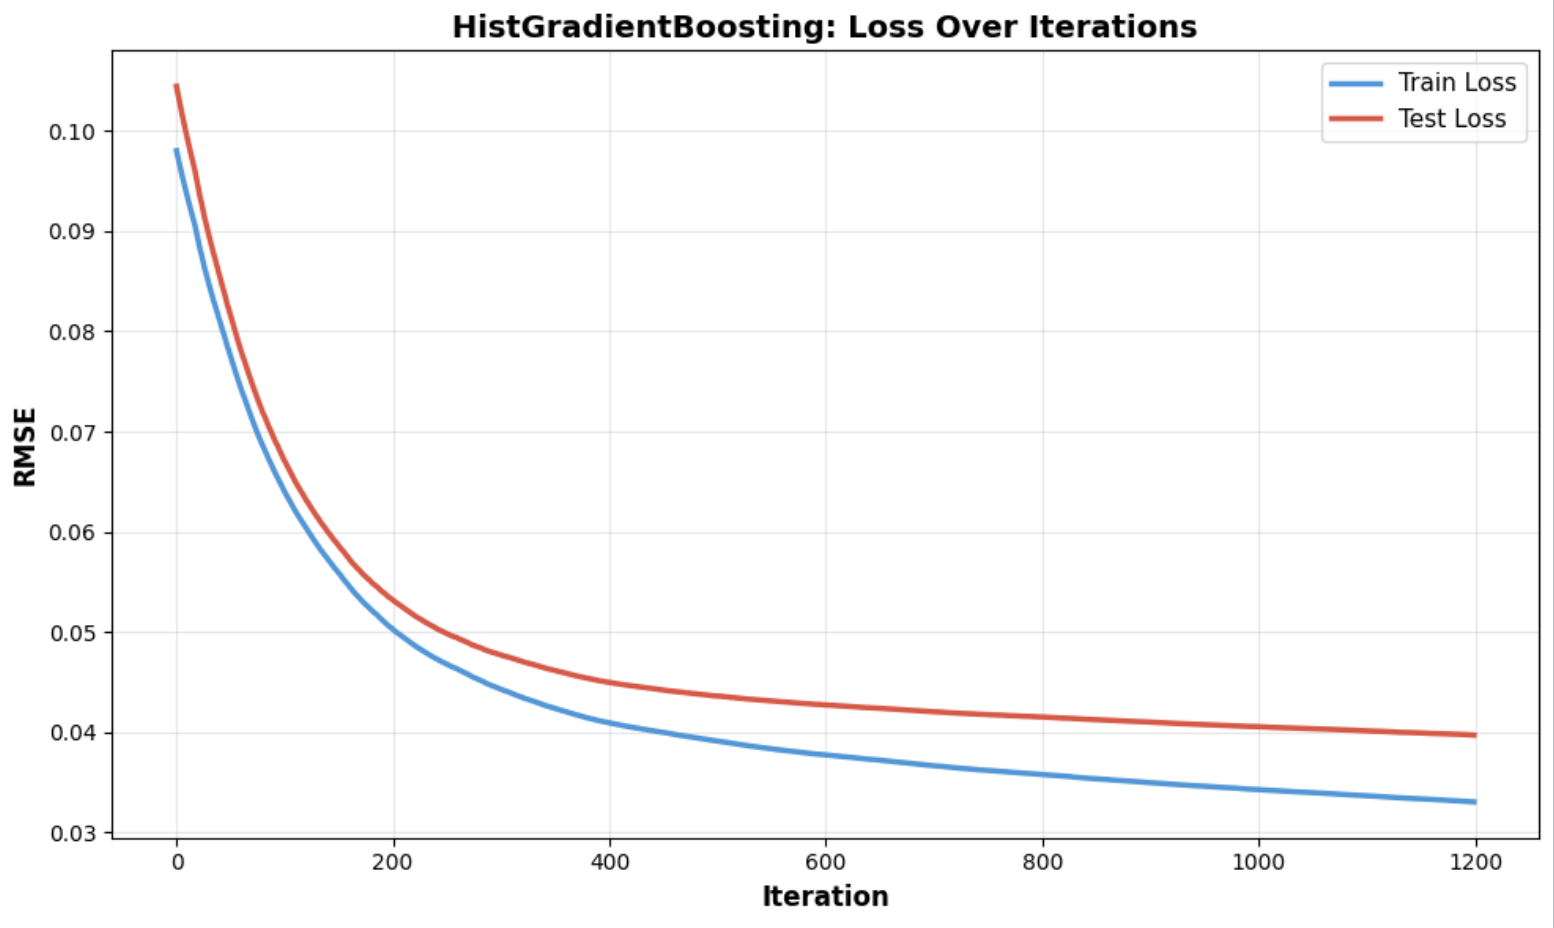
Compared to baseline models (Ridge, RandomForest), boosting approaches consistently outperformed simpler ensembles and linear methods.
Performance Comparison Across Models
Feature importance:
The interaction between capacity and market size ranked as the highest-importance feature, followed by EV market size and total capacity. Market-related features (including interactions), infrastructure specifications, and location context each contributed roughly equally to predictive power.
Error Analysis:
The model performed consistently across scenario types, with slightly higher errors in rural scenarios where sparse data made predictions more challenging.
Key takeaways
Deliberately designing interaction features based on problem understanding captured relationships that raw features missed. Features encoding capacity × market, fast charger × urban location, and roadside × traffic volume proved more valuable than relying on the model to discover these patterns automatically.
Performance improvements came from incorporating the right variables with appropriate feature engineering rather than algorithmic complexity. Infrastructure planning requires recognizing the complete picture: hardware capability, location context, and market demand constraints.
The broader lesson: prediction problems often depend on interactions between system components rather than individual properties. Identifying these constraints and encoding them explicitly as features is essential for accurate modeling.